How to check why the page is slow
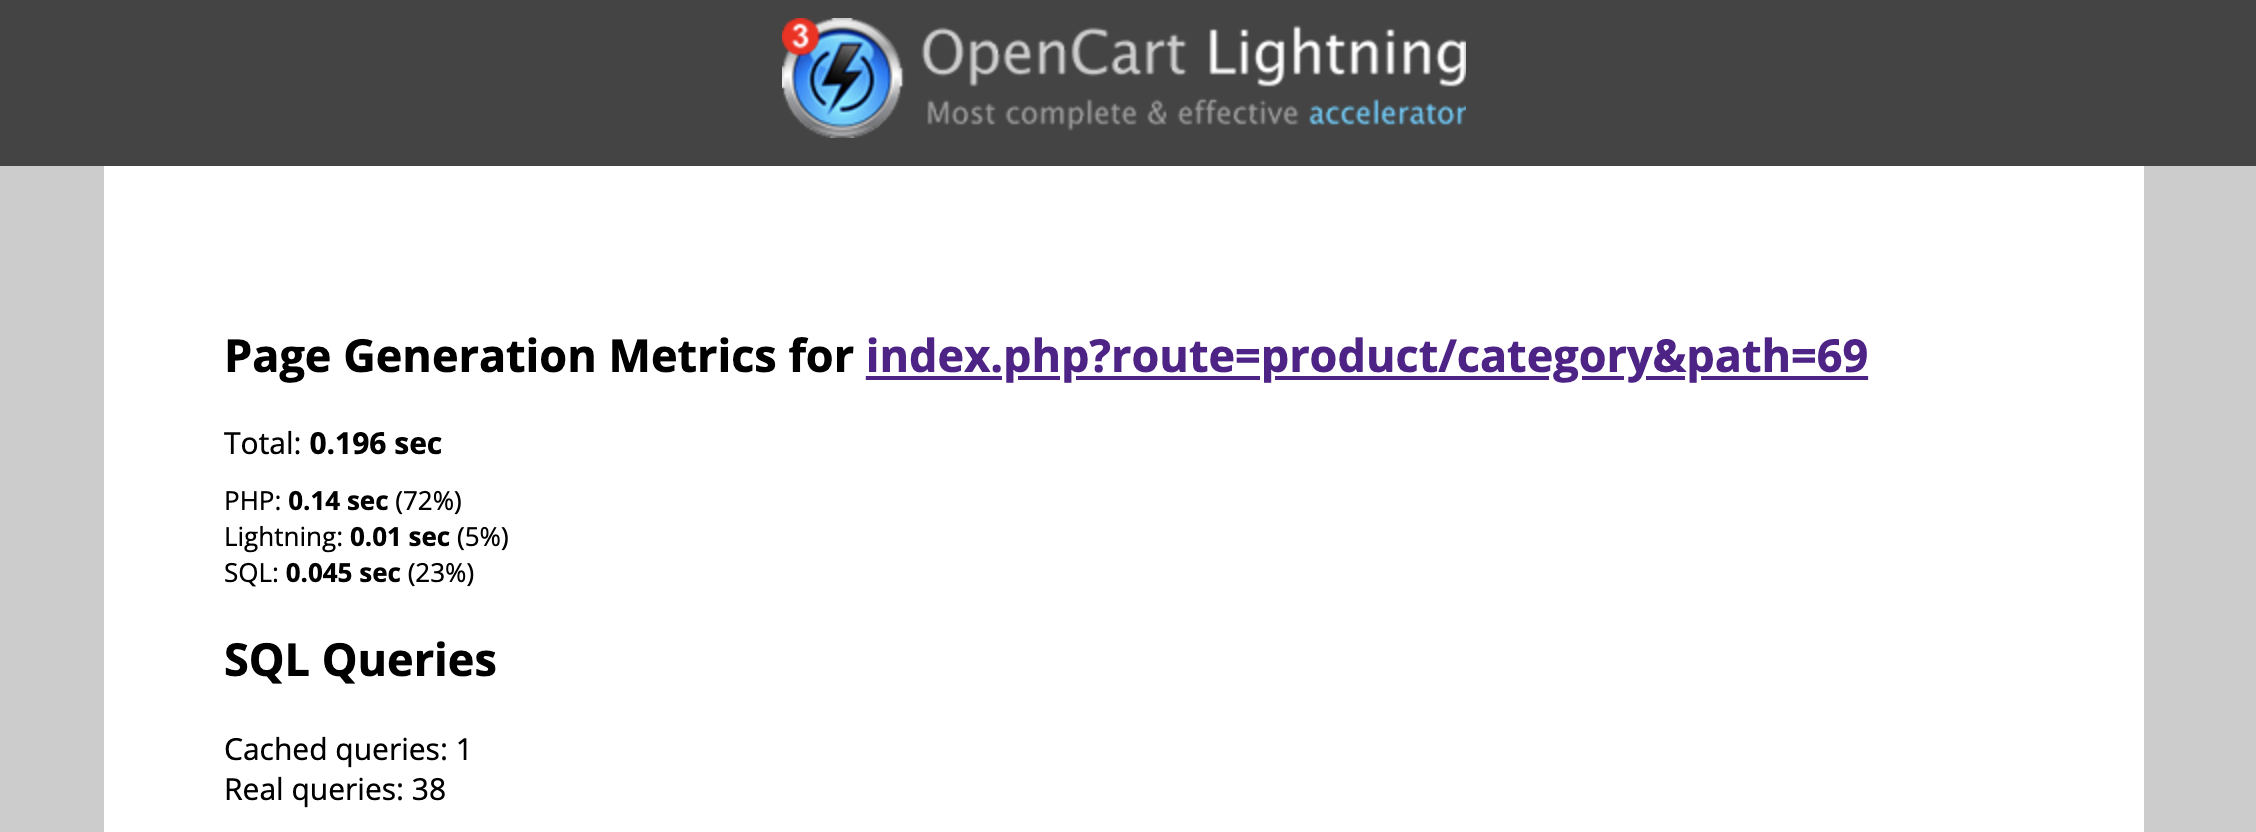
Lightning includes a powerful Page Generation Metrics tool that helps to see how the page is composed.
When you are logged as admin just add li_sql=1 parameter to page URL to see the detailed info:
Next it shows slow code parts and queries:
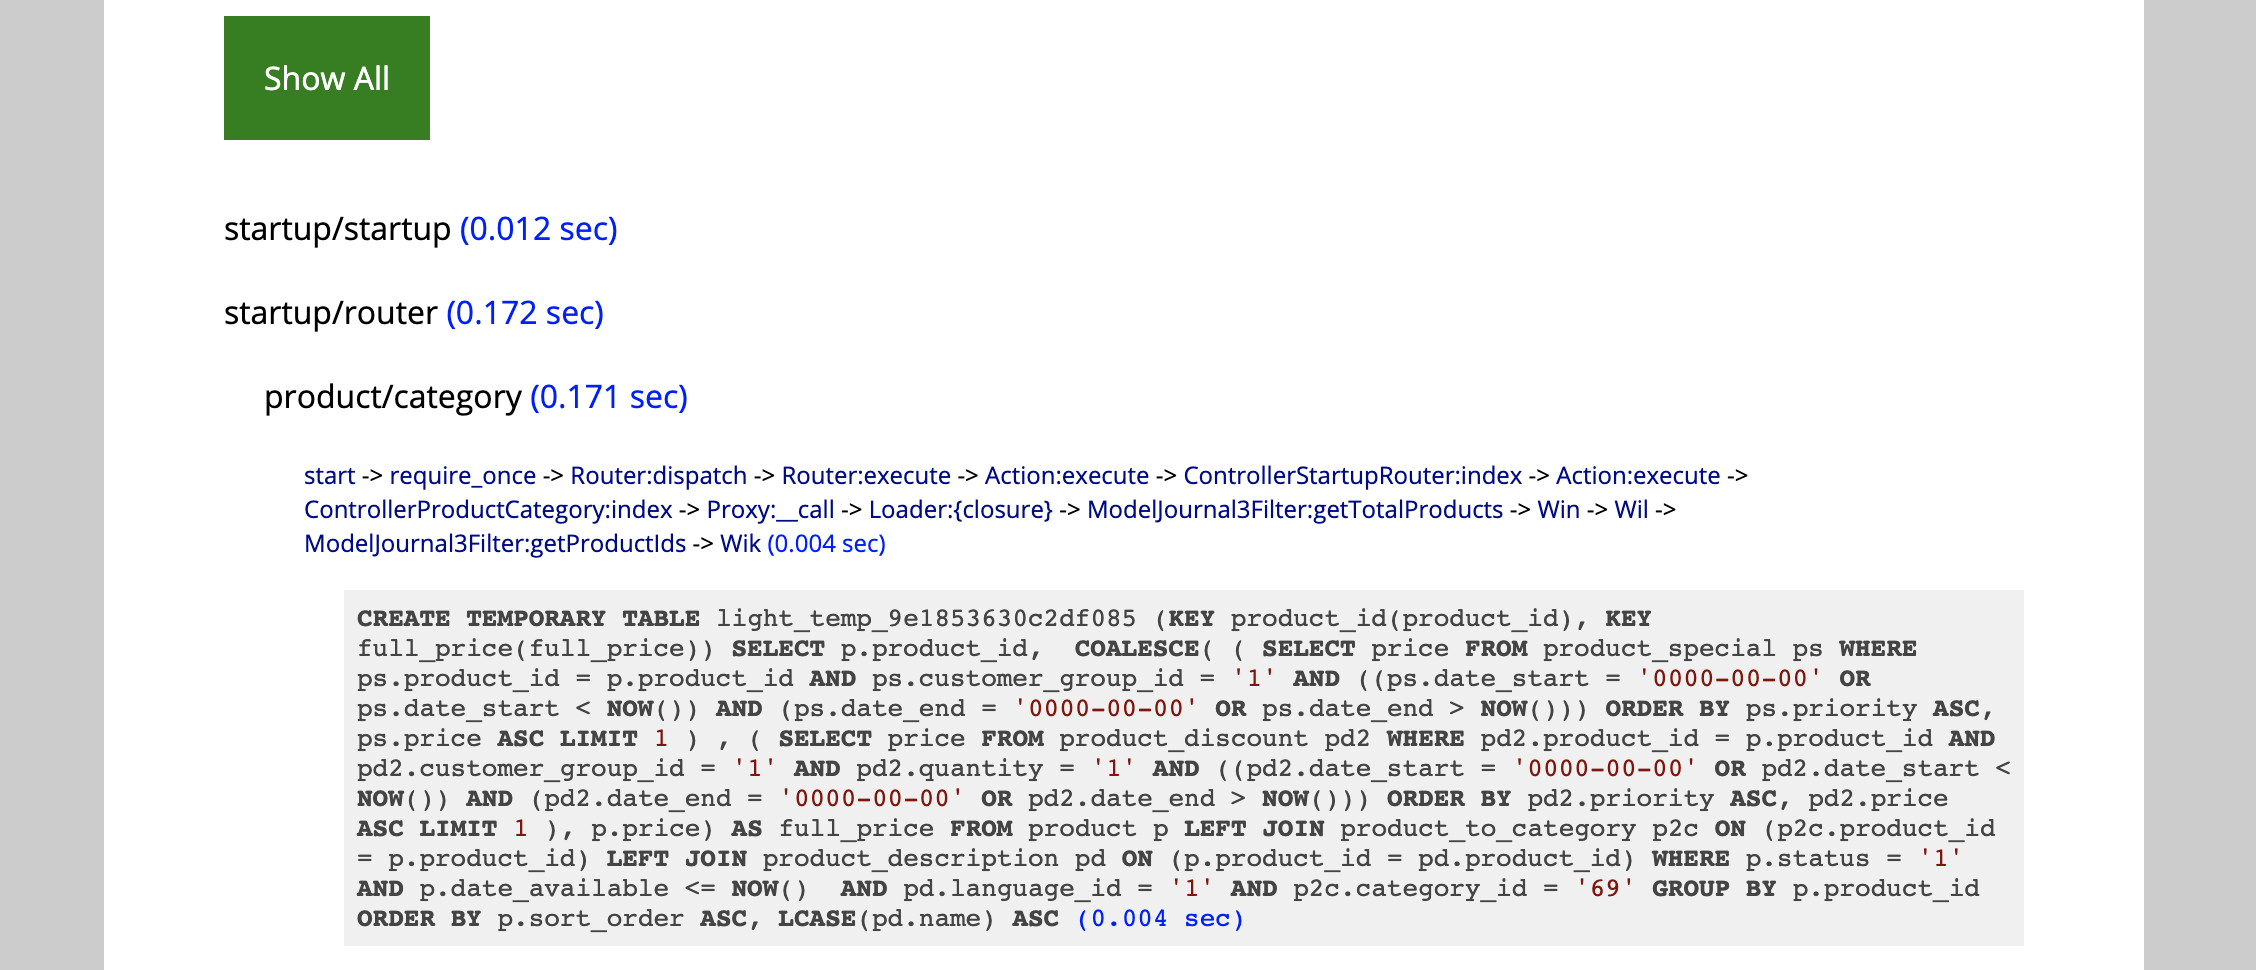
Also by pressing the Show All button you can see all queries, not only slow ones.
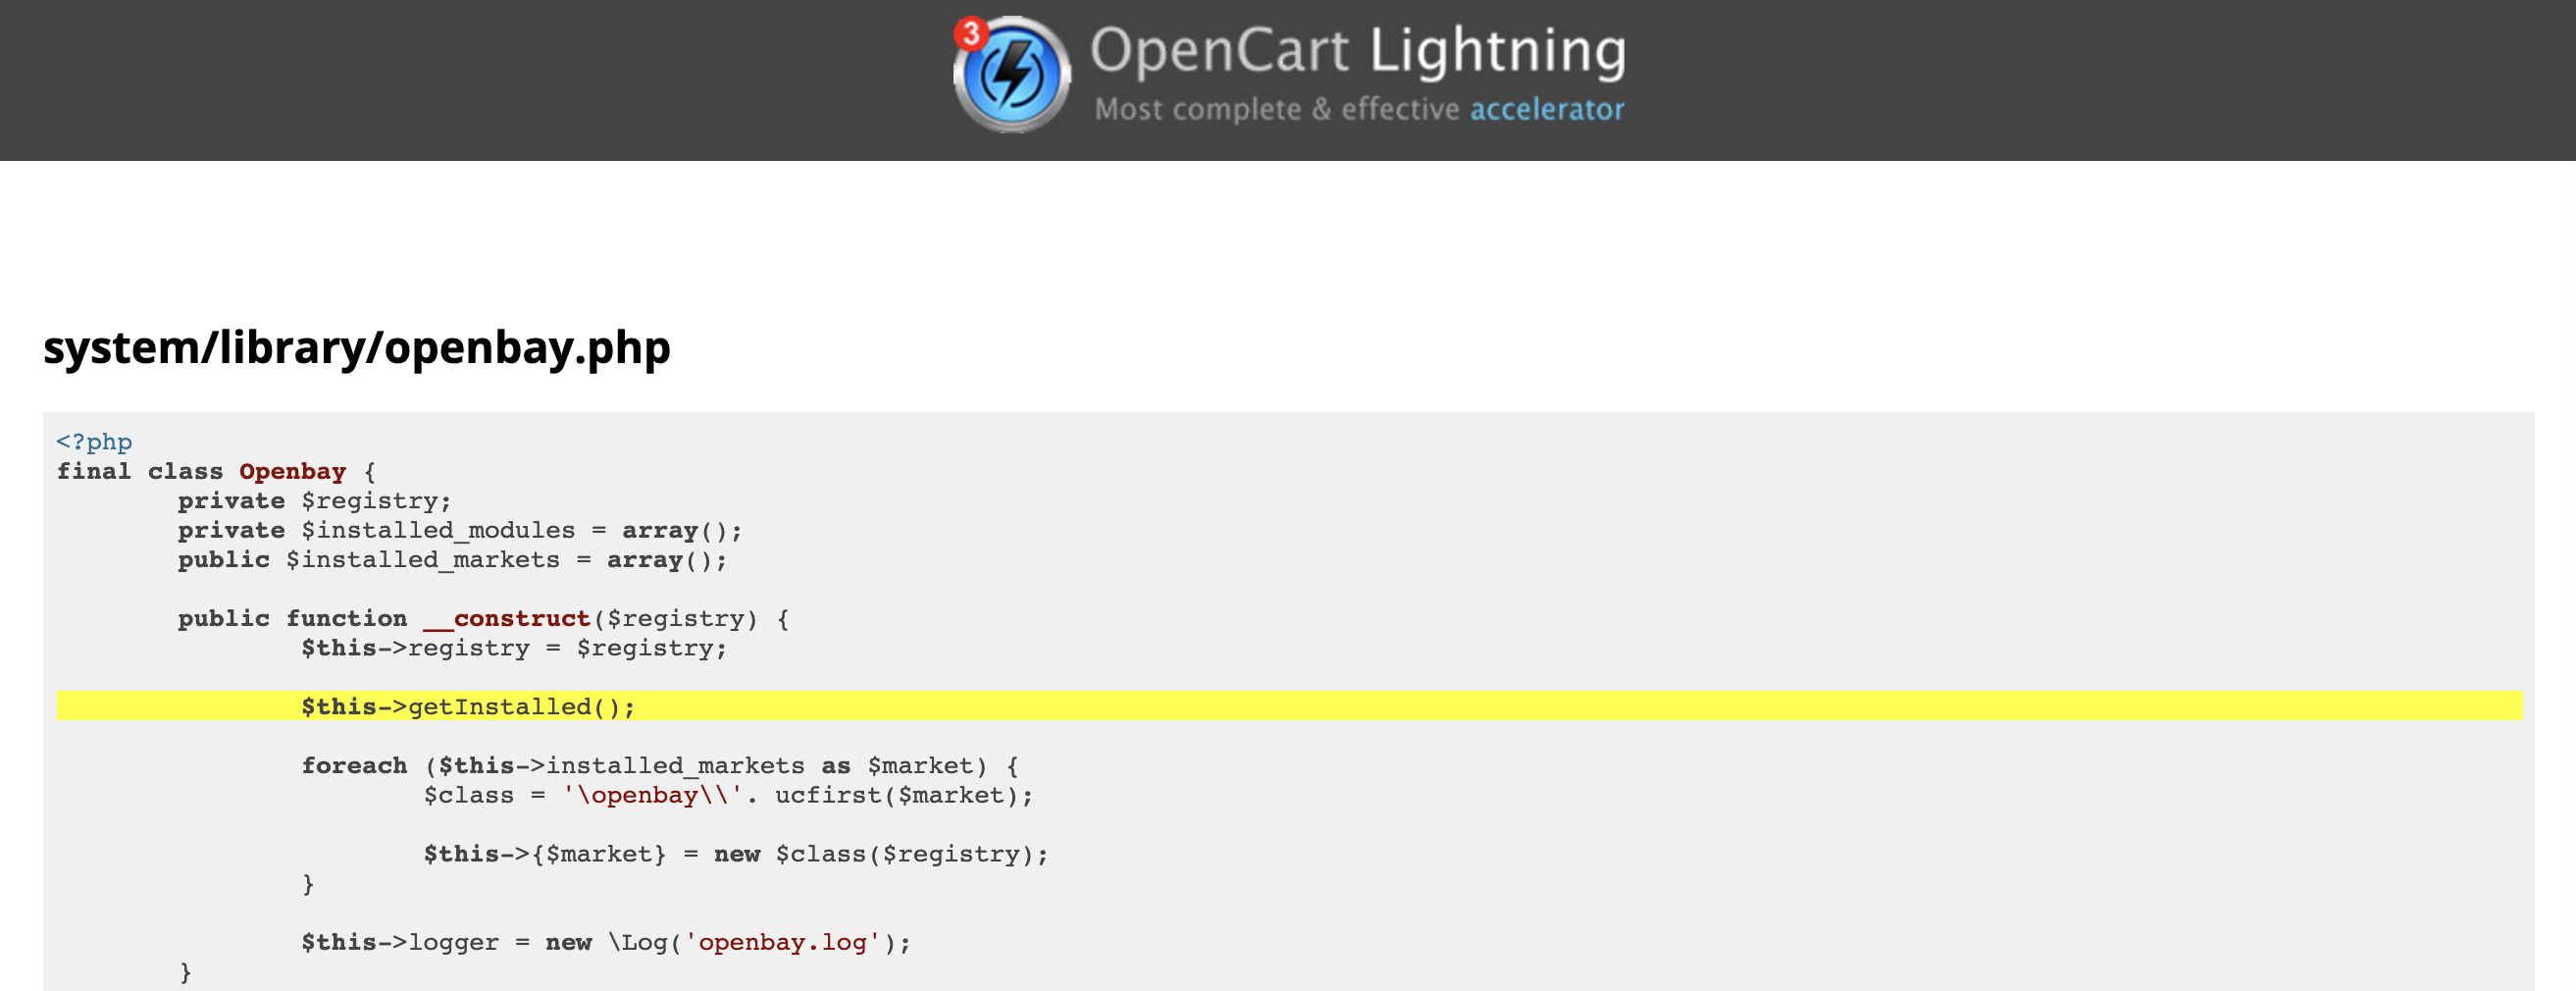
Pressing on code breadcrumbs you will see the file contents with calling line highlighted:
So, how to use this tool?
First of all, pay attention on queries number. If it is huge (1000+) - try to determine the most repetitive type. More likely, they take a lot of time in sum.
With the info displayed it is quite easy to determine the extension that generates that queries. After that you have a choice:
- remove that extension or change to similar one better optimized
- contact extension devs with the screenshots requesting a fix
- use Lightning caching to cache that code part

Second thing to do is to disable Lightning queries caching temporary and check for big and slow queries. Some of them also may lead to poorly optimized extensions.